Extending WooCommerce to show sales by country using JavaScript and React
06/02/2020
I recently did a test project for Automattic that involved developing a plugin for WooCommerce and documenting the entire process. Unfortunately, we didn't extend our collaboration, and the resulting tutorial wasn't made available in any decent form.
However, the folks at Automattic were nice enough to allow me publish it on my own blog, so here it is. This is roughly how the development workflow is like if you're looking to extend WooCommerce using its new, shiny JavaScript/React-based extensibility model. Right, no PHP. Well, almost.
...
With the release of WooCommerce 4.0 that now includes the WooCommerce Admin plugin, extension developers can take advantage of a new WooCommerce extensibility model based on JavaScript and React. You can use this new model when you modify existing or create new analytics reports, add new widgets to the new WooCommerce dashboard, or hook into WooCommerce breadcrumbs navigation.
If you've missed prior talk about this new JavaScript-focused experience that has evolved as part of WooCommerce Admin, here are some helpful links:
- Alpha-Test The New Javascript-driven WooCommerce Interface: Dashboard, Activity Panel, and Reports
- Extending WC-Admin Reports
- Integrating The New WooCommerce Navigation Bar
- WooCommerce Admin Components
In this tutorial, we'll take a closer look at this new extensibility model. We're going to walk through the process of creating a fully functional WooCommerce extension that displays an independent analytics report, gets data from the WooCommerce REST API, processes the data using JavaScript, gets a native look and feel by using a set of WooCommerce's own library of React components, integrates a third-party component when native components aren't enough, and gets by with only 60 lines of PHP code, of which 35 are generated.
By the end of the tutorial, the resulting extension should look like this:
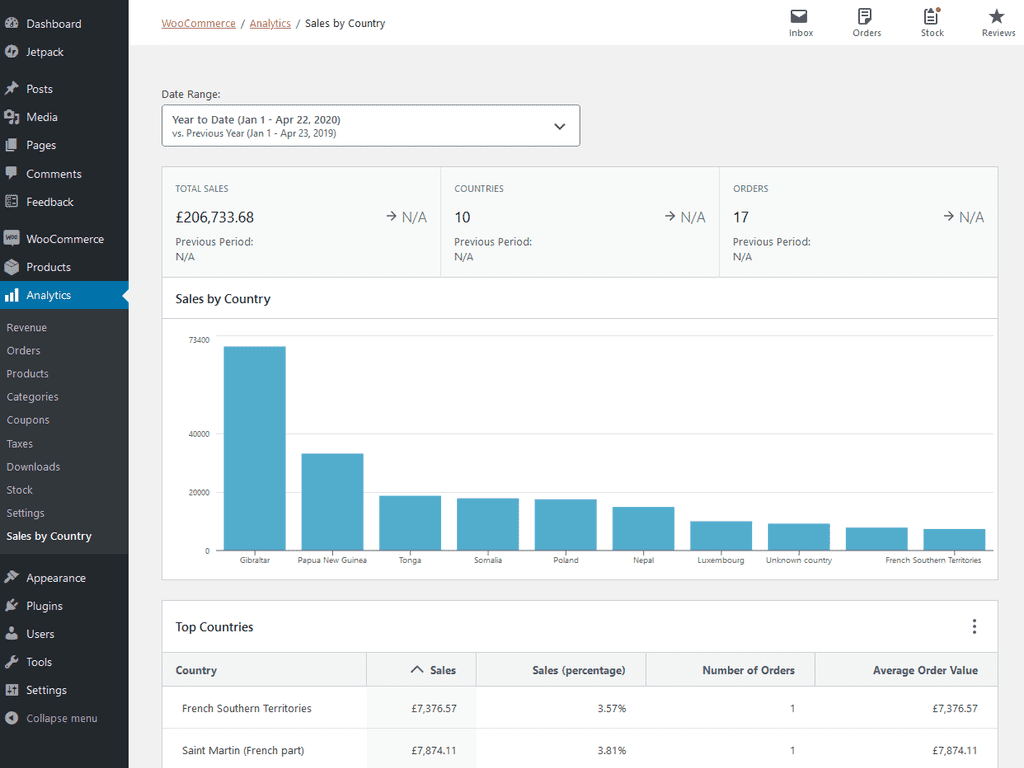
Full disclosure: this is a long tutorial. If you don't feel like following along, feel free to check out the source code of the resulting extension.
If you're ready to follow along, fasten your seatbelts, and let's see exactly what's ahead:
- What we're going to do
- What you'll need
- Preparing to get started
- Creating a standalone report
- Exploring available React components
- Extracting the extension's main React component to a separate file
- Adding mock data while live data isn't available
- Adding a date range selector
- Adding a report summary
- Adding a table view
- Fetching real data
- Updating data when a new date range is selected
- Adding native placeholder components to display while data is loading
- Adding a chart component to visualize per-country data
- Finishing touches
- That's it!
What we're going to do
To illustrate the new extensibility model driven by WooCommerce Admin, let's take an existing WooCommerce extension that makes heavy use of data visualization, and see how we can create something similar using JavaScript and React.
The extension that we're going to take inspiration from is Sales Report By Country for WooCommerce. The extension adds a new report tab that breaks down sales by country. It's available in WooCommerce's legacy Reports view (WP-Admin > WooCommerce > Reports), and looks like this:
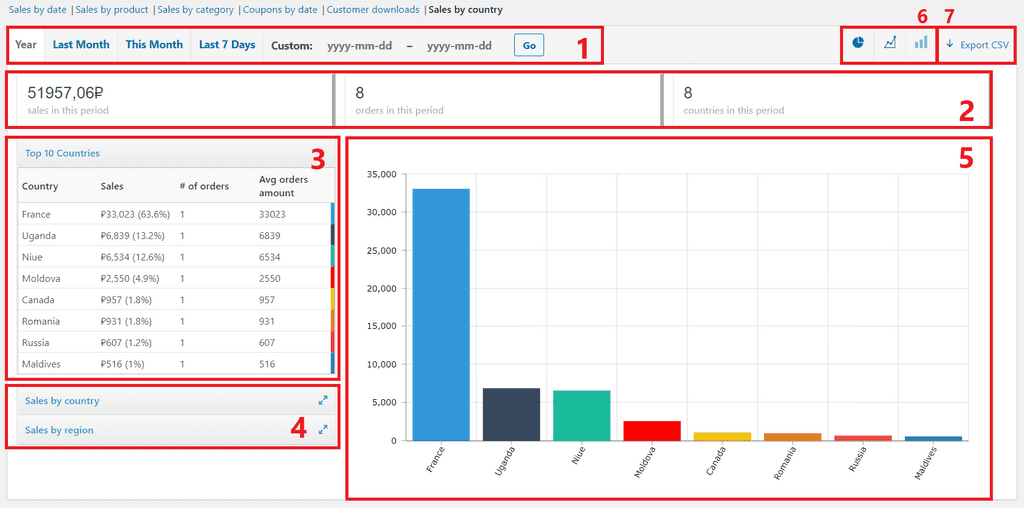
Let's break the extension down to individual components. It provides:
- A date range selector.
- An area to display total sales, orders and countries for a selected date range.
- A leaderboard-style table representing top 10 countries where orders from a selected date range are coming from.
- Country and region selectors that help focus on one or more countries or regions. Each of the selectors accepts multiple filters.
- A chart area to visualize data based on selected filters.
- Chart type controls. By default, a bar chart is used for visualization, but you can opt to use a line chart or a pie chart instead.
- Export to CSV.
We will not necessarily try to implement all of these features, but we'll see how far we can go.
What you'll need
- A local WordPress 5.3+ installation.
- WooCommerce 4.0 or later.
- Git.
- Node.js 12.0.0+. (Your installation will need to bundle npm 6.9 or later, which corresponds to Node.js 12.0.0 or later.)
Preparing to get started
Although WooCommerce Admin is now bundled with WooCommerce, it's still maintained as a plugin with a separate code base. This is what you'll need to use for the best development experience.
Clone the wc-admin repo to your local WordPress installation's wp-content/plugins directory.
In the root of the cloned repo (
{your_WordPress_installation}/wp-content/plugins/woocommerce-admin/), runnpm installto obtain JavaScript dependencies that WooCommerce Admin requires.In the root of the cloned repo, run
composer installto obtain PHP dependencies.
Creating a standalone report
Scaffolding with the starter pack
WooCommerce Admin provides something called a "starter pack" — a way to generate code that will serve as a starting point for developing a new extension. Among other files, the starter pack contains entry points for PHP and JavaScript parts of our new extension, package.json with default dependencies and available scripts, and webpack.config.js that defines JavaScript and Scss build processes using Webpack.
Here's how to generate boilerplate code for a new extension using the starter pack:
While still in the root of the cloned WooCommerce Admin repo, run
npm run create-wc-extensionto start scaffolding an extension template. When asked to specify a name for the extension, entersample-sales-by-country. As a result, the new extension will be scaffolded in a new subdirectory under your WordPress installation's/wp-content/plugins/directory: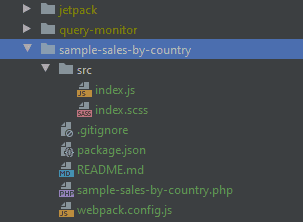
Go to the root directory of the extension that the starter pack has generated. Once there, run
npm installto obtain JavaScript dependencies defined in the extension'spackage.jsonfile.Once dependencies are installed, run
npm start. As a result, Webpack will spawn a development server and start watching for changes in JavaScript code to compile them on-the-fly.In our extension's
.phpfile, rename the registration function to make sure it has a unique name (such asadd_sample_sales_by_country_register_script), and update the second argument in theadd_action()call accordingly:PHPfunction add_sample_sales_by_country_register_script() {...}add_action( 'admin_enqueue_scripts', 'add_sample_sales_by_country_register_script' );Go to the admin area of your local WordPress installation, locate the new extension under Plugins > Installed Plugins, and activate it.
Making the extension discoverable via WordPress Admin sidebar
Our extension is now active but it doesn't do anything. Let's start by making it discoverable in the section of WordPress Admin (a.k.a. WP Admin) that WooCommerce uses.
First, let's add a link to the extension's page to WP Admin's sidebar. All WooCommerce reports powered by WooCommerce Admin are available under the Analytics group, so we'll add our extension there as well. To do this, we'll need to hook into a backend filter called woocommerce_analytics_report_menu_items.
Open our extension's main PHP file,
sample-sales-by-country.php.Add the following code to the end of the file:
PHPadd_filter( 'woocommerce_analytics_report_menu_items', 'add_sample_sales_by_country_to_analytics_menu' );function add_sample_sales_by_country_to_analytics_menu( $report_pages ) {$report_pages[] = array('id' => 'sample-sales-by-country','title' => __('Sales by Country', 'sample-sales-by-country'),'parent' => 'woocommerce-analytics','path' => '/analytics/sample-sales-by-country',);return $report_pages;}
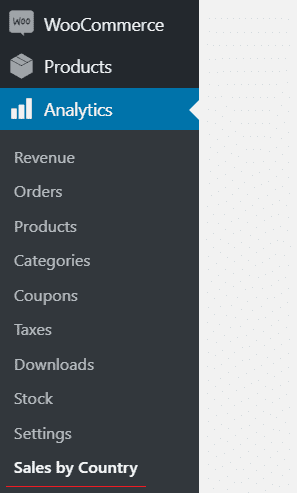
This will add our extension's page to the list of pages that WooCommerce Admin's Analytics class registers with WordPress to show under its Analytics page group in the sidebar. Once you refresh the admin view of your local WordPress installation, you should be able to see our extension, "Sales by Country", listed in the sidebar under Analytics:
Integrating the extension into WooCommerce's own breadcrumbs navigation
When WooCommerce 4 integrates into WP Admin, it creates a breadcrumbs navigation system that tries to glue together WooCommerce pages that are somewhat scattered across the admin area:

Let's add our extension to this navigation system right away. This is done on the frontend, so we'll take a first look at the JavaScript side of extensions powered by WooCommerce Admin.
You need to install 3 new dependencies that provide access to the JavaScript implementation of WordPress filter and action extensibility functions, frontend internationalization functions, and WordPress's own wrapper over React. To do this, run the following command in our extension's root directory:
SHELLnpm install @wordpress/hooks @wordpress/i18n @woocommerce/componentsOpen our extension's entry JavaScript file,
src/index.js.Remove all existing code from
index.js.Add import statements to make use of our new dependencies:
JAVASCRIPTimport {addFilter} from '@wordpress/hooks';import {__} from '@wordpress/i18n';import {Component as ReactComponent} from '@wordpress/element';Add a class for a stub React component that we will later expand to host our visualizations:
JAVASCRIPTexport class SalesByCountryReport extends ReactComponent {render() { return null }}Write an
addFilter()call that adds the report hosted by our extension to the list of WooCommerce Admin reports (here's how this list is populated inside WooCommerce Admin), sets a localizable title to use for the report in breadcrumbs navigation, and specifies the React component that the report will use:JAVASCRIPTaddFilter('woocommerce_admin_reports_list', 'sample-sales-by-country', (reports) => {return [...reports,{report: 'sample-sales-by-country',title: __('Sales by Country', 'sample-sales-by-country'),component: SalesByCountryReport},];});
(For more information about this filter, see Extending Reports in WooCommerce Admin documentation.)
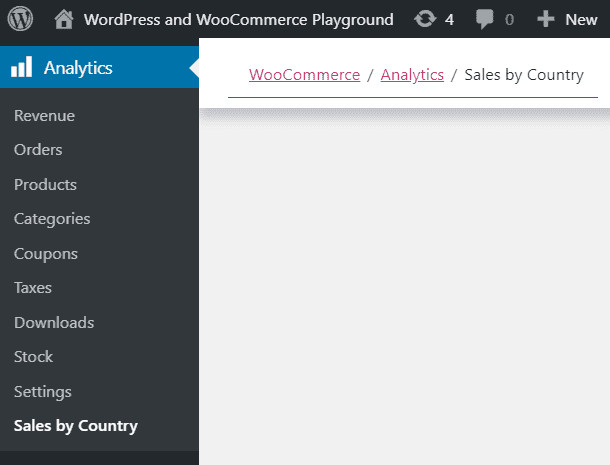
After refreshing our report's page in WP Admin, we should see the breadcrumbs navigation area correctly populated with the path to the report and its title:
Exploring available React components
Earlier, when talking about the existing extension that we're taking inspiration from, we have broken it down into constituents. Let's see how we can replicate these using the library of React components that WooCommerce Admin provides to us:
- A date range selector can be expressed by the
ReportFilterscomponent that combines powerful date range selection with advanced filtering. We won't be implementing advanced filters in our report, but it's nice to know that this option is available. For example, here's howReportFilterscombines date range selection and various options for filtering by category in WooCommerce's native Categories report: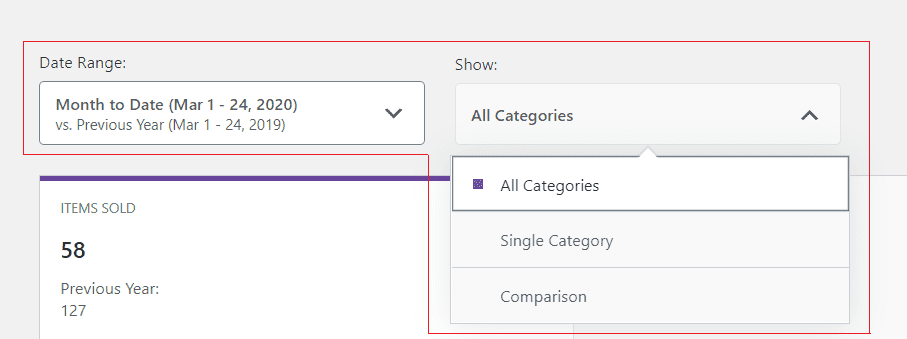
- To display total sales, orders and countries for a selected date range, we can use
ReportSummary. In out-of-the-box reports, this component looks like a set of cards that display stats and show stat-specific charts when clicked on. - To display top countries where orders come from, we'll need to create a wrapper table component like
RevenueReportTableand similar components that are used in all out-of-the-box reports for tabular data. This one will probably be based on theTableCardcomponent that's available to us via the@woocommerce/componentspackage. - For a chart area to visualize data based on selected filters, out-of-the-box reports use
ReportChart. It's built upon another component,Chart, that is available via the@woocommerce/componentspackage. However, there's something that prevents us from using either of these two components: they both can only plot time series data on the X axis. This is fine when we need to break down orders or sales by day, week, month or quarter, but leads us nowhere if we want to break data down by anything other than a time period. Since our goal is to break revenue down by customer country, we'll need to choose a third-party component.
Extracting the extension's main React component to a separate file
Now that we've discussed available React components, let's extract our main component to a separate file:
In the
srcdirectory that contains JavaScript code for our extension, create a new subdirectory,components.Under
components, create another new subdirectory,SalesByCountryReport. This is where we will develop the main React component of our extension.Under
SalesByCountryReport, create a new JavaScript file,SalesByCountryReport.js.Open our extension's entry JavaScript file,
src/index.js. Select and cut the stub React component that you created earlier, along with the import statement forReactComponent:JAVASCRIPT// src/index.jsimport {Component as ReactComponent} from '@wordpress/element';export class SalesByCountryReport extends ReactComponent {render() { return null }}Go back to
SalesByCountryReport.js, and paste the stub component and the import statement.Return to the entry file,
src/index.js, and add a statement to import the extracted component:JAVASCRIPTimport {SalesByCountryReport} from "./components/SalesByCountryReport/SalesByCountryReport";
We now have a file structure to host our main React component, SalesByCountryReport, and extend it further.
Adding mock data while live data isn't available
Before we move on to fetch real data from WooCommerce REST API, let's use mock data so that we have something to build our UI upon.
In the
srcdirectory whereindex.jsresides, create a new JavaScript file calledmockData.js.Open
mockData.js, and paste the following code:JAVASCRIPTexport const mockData = {"countries": [{"country": "France","country_code": "FR","sales": 33023.23,"sales_percentage": 50.37,"orders": 4,"average_order_value": 8255.8075},{"country": "South Korea","country_code": "KR","sales": 3760.72,"sales_percentage": 5.73,"orders": 1,"average_order_value": 3760.72},{"country": "Canada","country_code": "CA","sales": 1957.3,"sales_percentage": 2.98,"orders": 6,"average_order_value": 326.27},{"country": "Russia","country_code": "RU","sales": 607.44,"sales_percentage": 0.92,"orders": 3,"average_order_value": 202.48},{"country": "Croatia","country_code": "HR","sales": 26225.58,"sales_percentage": 40.00,"orders": 2,"average_order_value": 13112.79}],"totals": {"total_sales": 65574.27,"orders": 16,"countries": 5},"loading": false};Go to our main component file,
SalesByCountryReport.js, and import the mock data file:JAVASCRIPTimport {mockData} from '../../mockData';Add a constructor to the
SalesByCountryReportclass:JAVASCRIPTconstructor(props) {super(props);this.state = {data: mockData}}Now, whenever WooCommerce loads our
SalesByCountryReportcomponent, its state will be initialized with the imported mock data.
Speaking of state, there are several approaches to state management in React: the regular React state in class components, the state hook in function components, Redux, as well as the more WordPress-specific @wordpress/data. We're going to use the regular React state for the sake of simplicity, although in larger applications, this approach is arguably not ideal in terms of maintainability and separation of concerns.
Adding a date range selector
Let's start populating our main component, SalesByCountryReport, with other components that will make up our extension's UI. We'll start with WooCommerce's standard ReportFilters component that out-of-the-box analytics reports use to select a date range. This component is trivial to render and requires no customization, but it does require a few props to be passed to it, and to do that, we'll need to lay some groundwork.
The groundwork
First, let's install packages that
ReportFiltersrequires. To do this, run the following command in our extension's root directory:SHELLnpm install @woocommerce/date @woocommerce/currency @woocommerce/settingsWe'll need
@woocommerce/currencyand@woocommerce/settingsto find out what currency our WooCommerce installation uses, and to apply proper currency formatting to our data.@woocommerce/dateis used to construct date queries to get data for specific date ranges.Open
SalesByCountryReport.js, and add 5 new import statements:JAVASCRIPTimport {ChartPlaceholder, ReportFilters, SummaryList, SummaryListPlaceholder, SummaryNumber, TablePlaceholder} from '@woocommerce/components';import {__} from '@wordpress/i18n';import {appendTimestamp, getCurrentDates, getDateParamsFromQuery, isoDateFormat} from '@woocommerce/date';import {default as Currency} from '@woocommerce/currency';import {CURRENCY as storeCurrencySetting} from '@woocommerce/settings';These statements import all standard WooCommerce components that we're going to use directly in this class, a frontend internationalization function, date processing functions, our store's currency settings, and the
Currencyclass to apply these settings.In an existing statement that imports from '@wordpress/element', add a new imported item,
Fragment:JAVASCRIPTimport {Component as ReactComponent, Fragment} from '@wordpress/element';
The actual date range selector
Now that the groundwork is complete, let's finally add a date range selector to our main component:
Replace the existing
render()method of theSalesByCountryReportclass with the following:JAVASCRIPTrender() {const reportFilters =<ReportFiltersdateQuery={this.state.dateQuery}query={this.props.query}path={this.props.path}currency={this.state.currency}isoDateFormat={isoDateFormat}/>;return <Fragment>{reportFilters}</Fragment>}This is our actual date range selector, a.k.a. the
ReportFilterscomponent, that React will render into the DOM whenever our main component,SalesByCountryReport, is initialized or updated. It takes quite a few props: some passed through directly from the main component, some coming from the main component's state (we'll get to this next). If you're wondering what theFragmentcomponent is, it's just a way to group multiple elements returned by therender()method. Finally, the reason why we've extractedReportFiltersto a variable is that we'll later need to return this component both for the final UI and for placeholder UI while data is loading.Replace the existing
constructor()method of theSalesByCountryReportclass with the following:JAVASCRIPTconstructor(props) {super(props);const dateQuery = this.createDateQuery(this.props.query);const storeCurrency = new Currency(storeCurrencySetting);this.state = {dateQuery: dateQuery,currency: storeCurrency,data: mockData}}This is where we create a date query from the larger query that WooCommerce supplies to our component, in order to pass it over to
ReportFiltersthat requires it. This is where we're getting a currency setting from WooCommerce and use it to initialize aCurrencyobject that we will later use for currency formatting. We're also saving bothdateQueryandcurrencytoSalesByCountryReport's state because we'll need to pass these values to other components. Note that the method used to create a date query is not implemented yet, so let's fix this.Create a new method in the
SalesByCountryReportclass:JAVASCRIPTcreateDateQuery(query) {const {period, compare, before, after} = getDateParamsFromQuery(query);const {primary: primaryDate, secondary: secondaryDate} = getCurrentDates(query);return {period, compare, before, after, primaryDate, secondaryDate};}We called this method from the constructor to create a date query, and this is how it's implemented. All it does is call two methods that we imported from
'@woocommerce/date', and wrap the resulting data into a single object. We'll use this method again when we create an event handler that updatesSalesByCountryReportevery time we select a new date range.
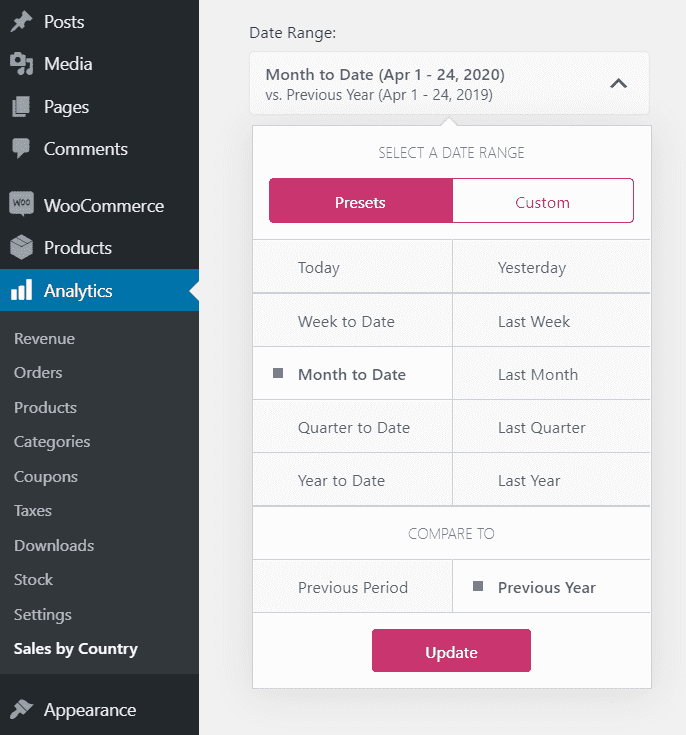
If you refresh our extension's page in the browser, you can see that it now contains a date range selector, just like the one used in out-of-the-box WooCommerce analytics reports. Nice!
Adding a report summary
Let's now add a summary area to display total sales, orders and countries. Remember that SalesByCountryReport has mock data loaded into its state, and we can display that data for our UI to make sense.
In
SalesByCountryReport'srender()method, add the following code right before thereturnstatement:JAVASCRIPTconst {data, currency} = this.state;In the
returnstatement, in the line following{reportFilters}, insert theSummaryListcomponent:JAVASCRIPT<SummaryList>{() => [<SummaryNumber key='sales'value={currency.render(data.totals.total_sales)}label={__('Total Sales', 'sample-sales-by-country')}/>,<SummaryNumber key='countries'value={data.totals.countries}label={__('Countries', 'sample-sales-by-country')}/>,<SummaryNumber key='orders'value={data.totals.orders}label={__('Orders', 'sample-sales-by-country')}/>]}</SummaryList>
Let's take a closer look at the SummaryList component:
- Note how it doesn't receive
SummaryNumbercomponents as immediate children; instead, it receives a function that returns an array ofSummaryNumbercomponents. - Each
SummaryNumbercomponent has 3 props:- The
keyprop provides a stable identity for eachSummaryNumber. This is important because under the hood, aSummaryNumberis a list item, and list items in React must have unique keys. - In the first
SummaryNumbercomponent,valueis formatted with therender()method of theCurrencyclass that we have instantiated in the constructor. This method makes sure to use the right currency symbol and decimal separator for whatever currency is set as the default in WooCommerce. - Labels are wrapped in an internationalization method call, which makes it easy to localize our extension to different languages if necessary.
- The
- To read more about
SummaryList,SummaryNumberandSummaryListPlaceholder, see WooCommerce Admin developer docs.
What if we hit refresh in our browser right now? Let's see:

Looks slick, doesn't it? It feels consistent with other analytics reports, and the total sales number is formatted properly. It does have a few N/A's here and there, and that's because we don't provide data for a previous period to compare the current date range with. In fact, we won't be adding support for previous periods in this tutorial, so let's just make sure these N/A's feel right at home.
Adding a table view
So far our extension only displays totals for countries, orders and sales. Let's now create a table that will display per-country sales performance.
To do this, we'll use TableCard, a component that is shipped as part of the @woocommerce/components library and is very similar to what WooCommerce uses in its out-of-the-box analytics reports. It combines a table, a table summary row to display totals, and a pagination control. We won't be using pagination, but otherwise TableCard is exactly what we need for tabular data presentation.
Creating a custom component to prepare table data
Since TableCard requires quite a lot of configuration to define table headers, rows and summary, we'll create a custom component, CountryTable, that will host code for this configuration and call TableCard with all the required props.
In
SalesByCountryReport.js, add a new statement to the list of existing import statements at the top of the file:JAVASCRIPTimport {CountryTable} from '../CountryTable/CountryTable';The component that we're importing here doesn't exist yet, but we'll create it in a moment.
Scroll down to the
render()method inSalesByCountryReport, and paste the following code after the declaration of thereportFiltersconstant:JAVASCRIPTconst tableHeaders = [{key: 'country', label: __('Country', 'wc-admin-sales-by-country'), isLeftAligned: true, isSortable: true, required: true},{key: 'sales', label: __('Sales', 'wc-admin-sales-by-country'), isSortable: true, isNumeric: true},{key: 'sales_percentage', label: __('Sales (percentage)', 'wc-admin-sales-by-country'), isSortable: true, isNumeric: true},{key: 'orders', label: __('Number of Orders', 'wc-admin-sales-by-country'), isSortable: true, isNumeric: true},{key: 'average_order_value', label: __('Average Order Value', 'wc-admin-sales-by-country'), isSortable: true, isNumeric: true},];This is how we configure table headers for our future
CountryTablecomponent. The reason we do this insideSalesByCountryReportis that later we'll also need to pass these headers to a table placeholder component.Scroll down to the return statement of the
render()method. Set the caret at the line after the closing element of our summary list (</SummaryList>), and paste the following code:JAVASCRIPT<CountryTable countryData={data.countries}totals={data.totals}currency={currency}headers={tableHeaders}/>This is how we render our
CountryTablecomponent. It's still not declared though, so let's do this.Under
src/components, create a new subdirectory,CountryTable.Under
CountryTable, create a new JavaScript file,CountryTable.js.Open
CountryTable.js, and paste the following code:JAVASCRIPTimport {__} from '@wordpress/i18n';import {Component as ReactComponent} from '@wordpress/element';import {TableCard} from '@woocommerce/components';export class CountryTable extends ReactComponent {render() {const countryData = this.props.countryData;const totals = this.props.totals;const currency = this.props.currency;const tableData = {headers: this.props.headers,rows: countryData.map(item =>[{display: item.country, value: item.country},{display: currency.render(item.sales), value: item.sales},{display: `${item.sales_percentage}%`, value: item.sales_percentage},{display: item.orders, value: item.orders},{display: currency.render(item.average_order_value), value: item.average_order_value},]),summary: [{key: 'sales', label: __('Sales in this period', 'wc-admin-sales-by-country'), value: currency.render(totals.total_sales)},{key: 'orders', label: __('Orders in this period', 'wc-admin-sales-by-country'), value: totals.orders},{key: 'countries', label: __('Countries in this period', 'wc-admin-sales-by-country'), value: totals.countries},]};return <TableCardtitle={__('Top Countries', 'wc-admin-sales-by-country')}rows={tableData.rows}headers={tableData.headers}rowsPerPage={100}totalRows={tableData.rows.length}summary={tableData.summary}/>}}
Let's see what's inside the code you've just pasted:
CountryTableis another React class component that currently only has therender()method implemented. There's no state in this component yet, so we can safely skip any custom constructor logic.- In
render(), thetableDataconstant collects headers, rows, and summary that are later passed to WooCommerce's nativeTableCardcomponent:headersis used exactly as declared in (and passed over from)SalesByCountryReport.rowsis incoming per-country data transformed so that for each cell in a table row,TableCardhas a raw value that can be used for sorting, and a display value that can be currency-formatted or otherwise decorated.summarycontains labels and display values forTableCard's summary block that is rendered after the table.
- When the
render()method returns aTableCard, it passes a set of props, includingheaders,rowsandsummaryand we've just discussed. Other props aretitlefor the table name displayed in the card header, as well asrowsPerPageandtotalRowsthat are normally used for pagination purposes. We're not going to implement pagination in our extension, but since these two parameters are required, we'll include them anyway.
When we refresh our extension's report page, here's what we should see:
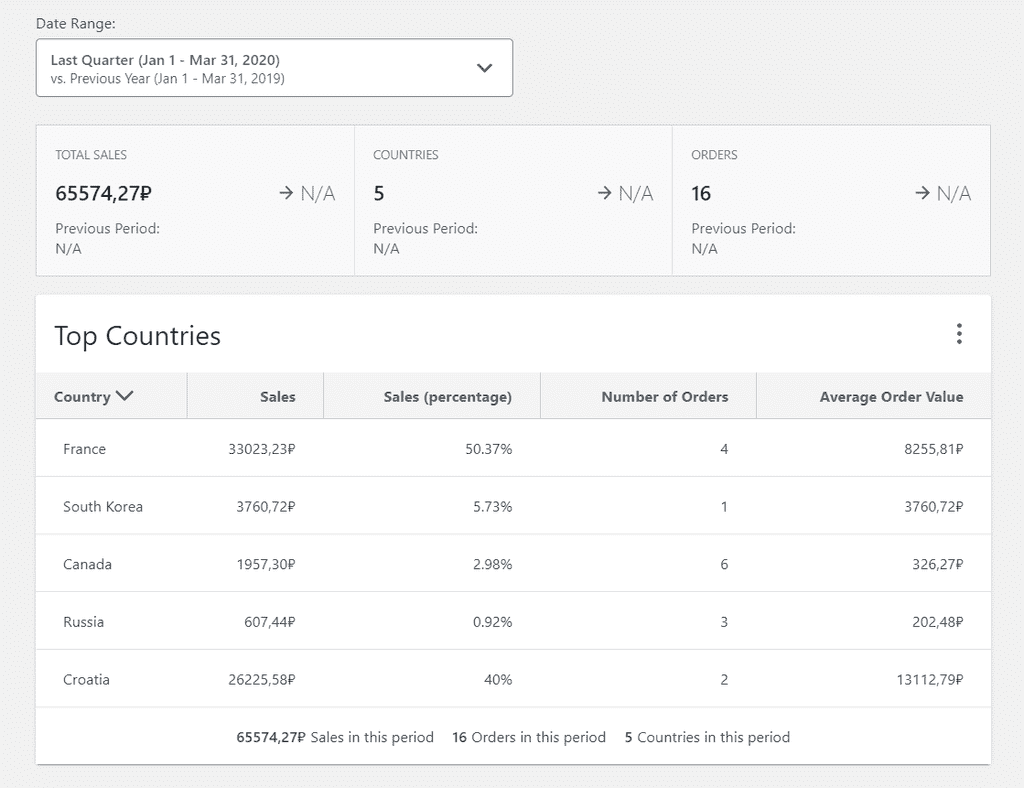
We now have a table component populated with our mock per-country sales data, along with a card header that lets you hide or show columns, and the summary block.
What happens when we click a header? Well, nothing, because we haven't implemented any kind of sorting so far. Let's do this next.
Making the table view sortable
Applying the default sort order
Sorting per-country data in our table is probably something that the table itself should be responsible for. If so, we need a way for the table to store data sorted in a particular way. For that, we'll need to add state to the CountryTable component, and initialize the state in a constructor.
In the
CountryTableclass, add the following constructor:JAVASCRIPTconstructor(props) {super(props);const defaultSortColumn = 'sales';const defaultSortOrder = 'desc';const countryDataSortedByDefault = this.sort(this.props.countryData, defaultSortColumn, defaultSortOrder);this.state = {countryData: countryDataSortedByDefault,sortColumn: defaultSortColumn,sortOrder: defaultSortOrder}}In the constructor, we define sorting defaults: when rendering the table initially, we want it sorted by absolute sales (
defaultSortColumn) in descending order (defaultSortOrder). Next, we call asort()method (which is yet to be defined) and pass these defaults along with the data received as props from our main component. Finally, we save the resulting sorted data along with applied sort and order options to a state object. Now, let's implement the sorting method.Add the following method to the
CountryTableclass:JAVASCRIPTsort(data, column, sortOrder) {const appliedSortOrder = sortOrder === 'asc' ? 1 : -1;return data.sort((a, b) => {if (a[column] > b[column]) return appliedSortOrder;if (a[column] < b[column]) return -1 * appliedSortOrder;return 0;});}Our
sort()method inCountryTableinvokes JavaScript's built-in array sort method on our per-country data array, and passes it a function that defines what exactly should be compared — values in the particular column that we want to sort by. However, before doing this, theappliedSortOrderconstant establishes the sort order that we want to apply. If the method receives a string representing the ascending order, theappliedSortOrderconstant is assigned1, which doesn't have any effect on the subsequent sort operation. If the method receives a string representing the descending order,appliedSortOrderis set to-1, and when passed to the compare function, this value reverses the order of items in the resulting sorted array.A constructor,
sort(), andapplySortOrder()is all we need to get per-country data sorted by default. In order to actually render the sorted data, we need to make a small but important change. In the first line inrender(), you should have thecountryDataconstant declared and initialized. Select its initialization expression,this.props.countryData, and replace it with this:JAVASCRIPTthis.state.countryData
Enabling changes to sort column and order
So far we've managed to apply the default sort order to the per-country data that the CountryTable component receives from SalesByCountryReport. What we need to do now is make sure that whenever we click a table header, data in the table either changes its sort order or is re-sorted by a new column. This will require a few changes to the CountryTable class:
In the return statement of
CountryTable'srender()method, add a new prop to theTableCardcomponent that you return:JAVASCRIPTonSort={this.handleSort}This tells
TableCardthat whenever a sortable table header is clicked, it should invoke thehandleSort()method defined inCountryTable. Well, it's not actually defined yet, so let's do that next.Insert a new method,
handleSort(), into theCountryTableclass:JAVASCRIPThandleSort(newSortColumn) {let {countryData, sortColumn, sortOrder} = this.state;if (sortColumn === newSortColumn) {countryData.reverse();sortOrder = this.changeSortOrder(sortOrder);}else {sortColumn = newSortColumn;countryData = this.sort(countryData, sortColumn, sortOrder);}this.setState({countryData: countryData,sortColumn: sortColumn,sortOrder: sortOrder});}This is the method that we want to invoke whenever a sortable table header is clicked. The method receives one argument, which is a key for the header that was clicked, and it helps us identify which column the user wants to re-sort by. If table data is currently sorted by that column, we just reverse the sort order. If table data is currently sorted by a different column than that passed over to the method, we re-sort by the new column without changing the sort order. Finally, we save re-sorted data, current sort column and sort order to component state. When React detects that state has been updated, it automatically re-renders the
CountryTablecomponent for us.The
handleSort()method calls another method,changeSortOrder(), which isn't currently defined, and we need to fix this. Insert the following new method into theCountryTableclass:JAVASCRIPTchangeSortOrder(order) {return order === 'asc' ? 'desc' : 'asc';}Since we're passing
handleSortas a prop toTableCard, andthisin JavaScript works the way it works, we need to bindhandleSort()to the context of theCountryTableclass. To do this, insert the following code at any line aftersuper(props)inCountryTable's constructor:JAVASCRIPTthis.handleSort = this.handleSort.bind(this);Insert the following new method into the
CountryTableclass:JAVASCRIPTsetHeaderSortOptions(header) {if (header.key === this.state.sortColumn) {header.defaultSort = true;header.defaultOrder = this.state.sortOrder;} else {if (header.defaultSort) delete header.defaultSort;if (header.defaultOrder) delete header.defaultOrder;}return header;}This method locates the header of a column that data is currently sorted by, and assigns additional properties,
defaultSortanddefaultOrder, to that header. At the same time, these two properties are removed from headers of all other columns. As a result, the current sort column gets highlighted, and its header properly indicates the current sort order. Now, let's just add a call to this method in the next step.In
CountryTable'srender()method, locate thetableDataconst and itsheadersproperty. Replace the current value of theheadersproperty (this.props.headers) with this:JAVASCRIPTthis.props.headers.map(header => this.setHeaderSortOptions(header))
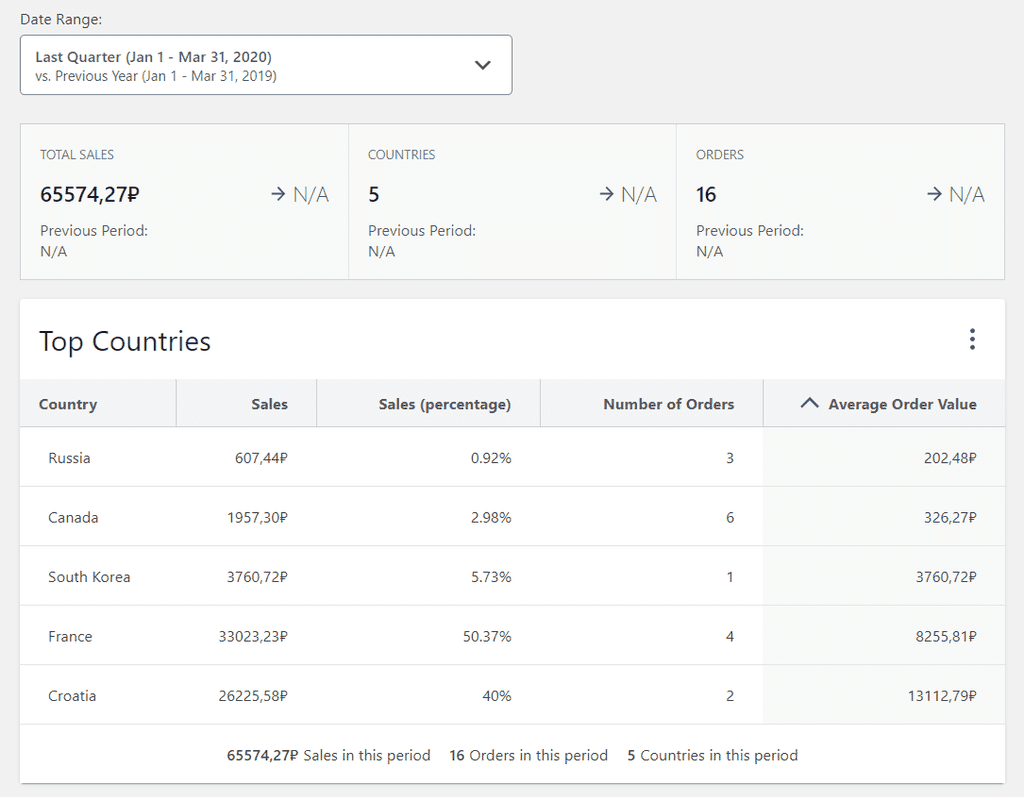
At this point, we should be all set with re-sorting data. After refreshing the page of our extension in your browser, try clicking column headers and see what happens. What you should see is data re-sorted, current sort column highlighted, and sort order indicators in headers correctly displayed:
Fetching real data
Our extension already looks nice — that is, until we realize that we're still dealing with mock data. It's time to start writing code that will get us real, live data from our WooCommerce installation, and then transform the data to the format that we expect. Let's get started.
In the constructor of
SalesByCountryReport, select the entire statement that initializesthis.state, and replace it with the following:JAVASCRIPTthis.state = {dateQuery: dateQuery,currency: storeCurrency,allCountries: [],data: { loading: true }};We have added and initialized two state properties:
allCountrieswill store all countries that our WooCommerce installation knows about. Since the set of countries isn't going to change, we will fetch it once, store it in this state property, and read it from there instead of re-fetching.data.loadingwill be used as a switch to tell React what to render: if data has not finished loading (data.loading === true), we want to display some kind of placeholder on our extension's page; if it has finished loading (data.loading === false), we want to display the actual loaded data.
In the next line in the constructor, insert another statement:
JAVASCRIPTthis.fetchData(this.state.dateQuery);Since we no longer use mock data, we're calling the
fetchData()method from the constructor to start requesting initial data when our component is loaded for the first time. The method is not defined yet, and our next step is to fix this.Paste a new method into
SalesByCountryReport:JAVASCRIPTfetchData(dateQuery) {if(!this.state.data.loading) this.setState({data: {loading: true}});const endPoints = {'countries': '/wc/v3/data/countries?_fields=code,name','orders': '/wc-analytics/reports/orders?_fields=order_id,date_created,date_created_gmt,customer_id,total_sales','customers': '/wc-analytics/reports/customers?_fields=id,country'};const queryParameters = this.getQueryParameters(dateQuery);const countriesPath = endPoints.countries;const ordersPath = endPoints.orders + queryParameters;const customersPath = endPoints.customers + queryParameters;Promise.all([this.state.allCountries.length === 0 ? apiFetch({path: countriesPath}) : Promise.resolve(this.state.allCountries),apiFetch({path: ordersPath}),apiFetch({path: customersPath})]).then(([countries, orders, customers]) => {const data = this.prepareData(countries, orders, customers);this.setState({data: data, allCountries: countries})}).catch(err => console.log(err));}Let's see what's going on here:
- First, we make sure that the
data.loadingstate property is set totrue, which we'll use to show a placeholder while data is loading. This line won't be executed when the method is called from the constructor, because in this casedata.loadingis already set totrue; however, we'll need this line later, as we learn to update data when a selected date range changes. - Next, we declare
endPoints— an object that holds relative paths to the 3 WooCommerce REST API endpoints that we'll use to fetch data. Since all these endpoints can return more data than we need, we append the_fieldsquery parameter to limit the data fields that are sent to our extension. - When URLs for our endpoints are ready, we start requesting them asynchronously using
Promise.all, which will only let us proceed once responses to all requests have been received and the corresponding promises resolved. Note that a request to thecountriesendpoint is only sent if countries are not yet saved to component state. - As soon as all promises are resolved, the
prepareData()method transforms data to a format we can use to populate our report. We'll declareprepareData()later. - Whatever
prepareData()returns is put into the component state, and when the state updates, React triggers re-rendering of the component with ready-to-use data.
- First, we make sure that the
fetchDatauses a method,apiFetch, from a library that we don't have installed yet. To fix this, run the following command in the root directory of our extension:SHELLnpm install @wordpress/api-fetchBack in
SalesByCountryReport, scroll up to the imports section, and add a new import statement:JAVASCRIPTimport apiFetch from '@wordpress/api-fetch';Add the following method into
SalesByCountryReport:JAVASCRIPTgetQueryParameters(dateQuery) {const afterDate = encodeURIComponent(appendTimestamp(dateQuery.primaryDate.after, 'start'));const beforeDate = encodeURIComponent(appendTimestamp(dateQuery.primaryDate.before, 'end'));return `&after=${afterDate}&before=${beforeDate}&interval=day&order=asc&per_page=100&_locale=user`;}We call this method from
fetchData()to get a set of query parameters to use when requesting REST API endpoints. Some of these parameters are hardcoded, but the two parameters that define the boundaries of a date range are calculated. Notably, we append timestamps to both dates, and then encode the resulting timestamps in a way that's suitable for use in URLs.Insert a new method into
SalesByCountryReport:JAVASCRIPTprepareData(countries, orders, customers) {let data;if (orders.length > 0) {const ordersWithCountries = this.getOrdersWithCountries(orders, customers, countries);data = this.getPerCountryData(ordersWithCountries);data.totals = {total_sales: this.getTotalNumber(data.countries, 'sales'),orders: this.getTotalNumber(data.countries, 'orders'),countries: data.countries.length,};data.countries = data.countries.map(country => {country.sales_percentage = Math.round(country.sales / data.totals.total_sales * 10000) / 100;country.average_order_value = country.sales / country.orders;return country;});} else {data = {countries: [],totals: {total_sales: 0,orders: 0,countries: 0}}}data.loading = false;return data;}This method is responsible for transforming the data received from REST API endpoints to a format used in our component state. If we have received data on at least a single order in a requested date range, we call 2 methods that we'll discuss next,
getOrdersWithCountries()andgetPerCountryData(). This gives us a basic per-country data structure that we then extend with sales, order and country totals, as well as calculated sales percentages and average order values for each country.Add another method to
SalesByCountryReport:JAVASCRIPTgetOrdersWithCountries(orders, customers, countries) {return orders.map(order => {order.country_code = customers.find(item => item.id === order.customer_id).country;const country = countries.find(item => item.code === order.country_code);order.country = country ? country.name : __('Unknown country', 'wc-admin-sales-by-country');return order;});}This method is called from
prepareData(), and it maps each order to a specific country that the order was made from. To do this, it first gets a country code from a customer entry that matches a given customer ID, and then it finds the full country name by a given country code in thecountriesarray. Some customers may not have country information in their profiles, and if that's the case, an order is tagged with "Unknown country".Add (you guessed it) yet another method to
SalesByCountryReport:JAVASCRIPTgetPerCountryData(ordersWithCountries) {return ordersWithCountries.reduce((accumulator, currentObject) => {const countryCode = currentObject['country_code'];if (!accumulator.countries) accumulator.countries = [];if (!accumulator.countries.find(item => item.country_code === countryCode)) {const countryObjectTemplate = {'country': currentObject['country'],'country_code': countryCode,'sales': 0,'sales_percentage': 0,'orders': 0,'average_order_value': 0};accumulator.countries.push(countryObjectTemplate)}const countryIndexInAccumulator = accumulator.countries.findIndex(item => item.country_code === countryCode);accumulator.countries[countryIndexInAccumulator].sales += currentObject.total_sales;accumulator.countries[countryIndexInAccumulator].orders++;return accumulator;}, {});}This is another method called from
prepareData(). Essentially, it takes an array of orders with information on which countries they were made from, and transforms it into an array of countries. For each country, it calculates total sales and the number of orders made.Add the final
SalesByCountryReportmethod that you'll need in this section:JAVASCRIPTgetTotalNumber(data, property) {const propertyTotal = data.reduce((accumulator, currentObject) => accumulator + currentObject[property], 0);return Math.round(propertyTotal * 100) / 100;}This is the last method called from
prepareData()that we needed to define. This is a utility method that calculates the total for a given numerical property (such as sales or orders), and returns it after rounding.In the
render()method, select the entire return statement, and replace it with this:JAVASCRIPTif (this.state.data.loading) { return <p>Waiting...</p> }else {return <Fragment>{reportFilters}<SummaryList>{() => [<SummaryNumber key='sales'value={currency.render(data.totals.total_sales)}label={__('Total Sales', 'sample-sales-by-country')}/>,<SummaryNumber key='countries'value={data.totals.countries}label={__('Countries', 'sample-sales-by-country')}/>,<SummaryNumber key='orders'value={data.totals.orders}label={__('Orders', 'sample-sales-by-country')}/>]}</SummaryList><CountryTable countryData={data.countries}totals={data.totals}currency={currency}headers={tableHeaders}/></Fragment>}This revision of the return statement adds a condition whereby a set of components that hold data is only returned once data has finished loading. While data is still loading, only a short progress message is rendered. (Later, we will replace this quick progress message with a more professional looking set of placeholder components.)
Since we're no longer using mock data, scroll up to the imports section in
SalesByCountryReport, and remove the line that imports{mockData}.Go to the root of the
srcfolder, and deletemockData.js: you won't need it from now on.
Let's refresh our extension page, and see what it displays:
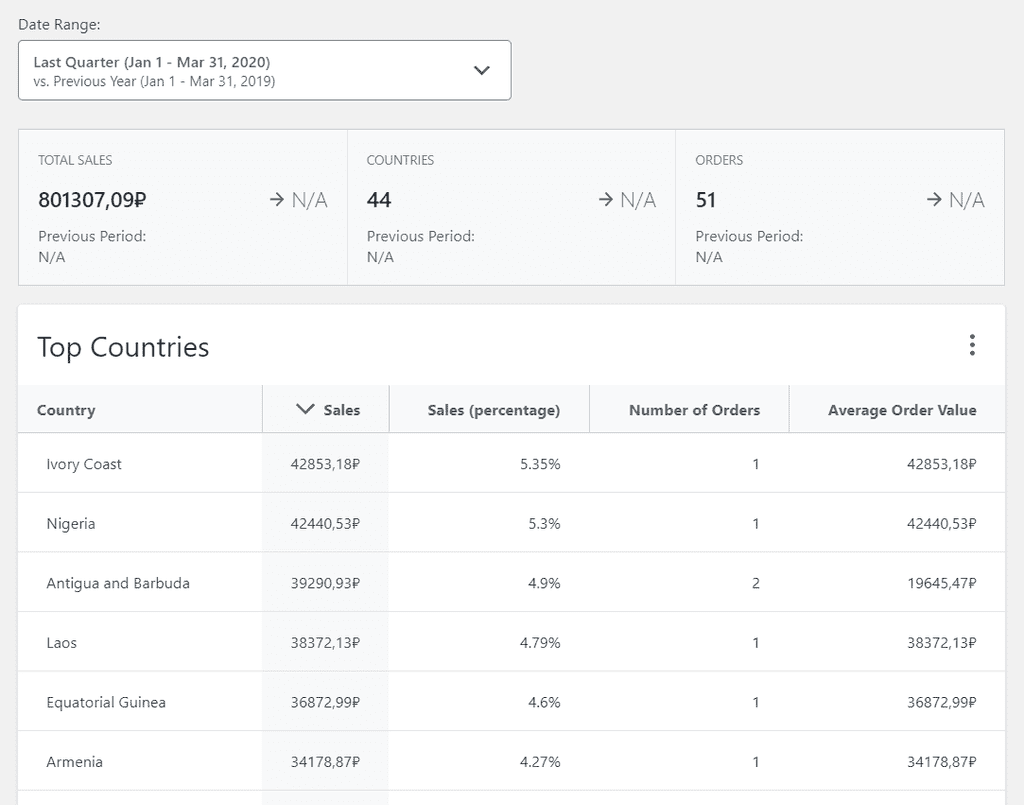
This smells like success! There are 44 countries listed for the selected period: if we scroll down a few times, here's what the end of the table looks like:
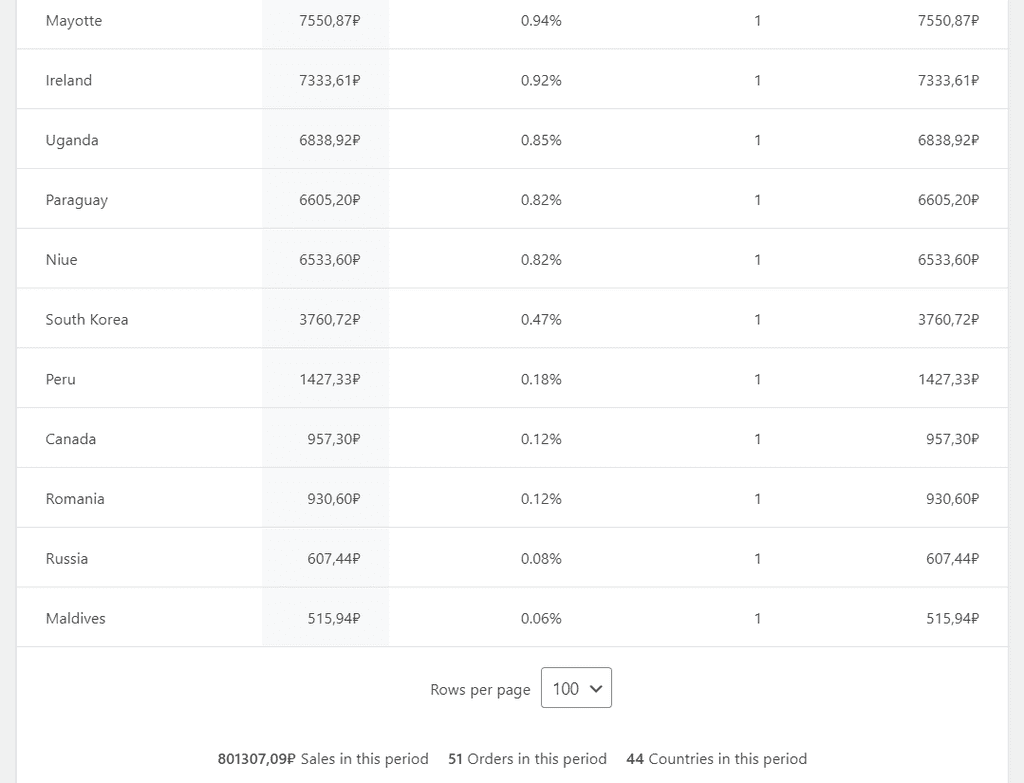
Granted, since this is live data, you'll see different numbers, and probably a different currency setting, in your own installation.
Updating data when a new date range is selected
Fetching live data from REST API and displaying it in our report is a good start, but we don't currently have a working way to update the data when we select a new date range using the ReportFilters component. It's time to fix this.
- In
SalesByCountryReport'srender()method, find where you're calling theReportFilterscomponent, and add a new prop to the call:We're tellingJAVASCRIPTonDateSelect={this.handleDateChange}ReportFiltersto callhandleDateChange()every time we select a new date range and click Update. Next, let's declarehandleDateChange()itself. - Add a new method to
SalesByCountryReport:Every timeJAVASCRIPThandleDateChange(newQuery) {const newDateQuery = this.createDateQuery(newQuery);this.setState({dateQuery: newDateQuery});this.fetchData(newDateQuery);}ReportFilterschanges a date range,handleDateRange()will receive an argument representing this new date range. It needs to be processed into a proper date query similar to we did with the original date range in the constructor. Once that's done,handleDateRange()saves the new date query into component state, and callsfetchDatato send API requests for the new date range, and process it further as we discussed above. For all this to work, we need to remember to make one more small change. - Scroll up to the constructor in
SaleseByCountryReport, and add the following code at any line after thesuper(props)call:Once again, we need this to bindJAVASCRIPTthis.handleDateChange = this.handleDateChange.bind(this);handleDateChange()to the context ofSalesByCountryReport.
This is all we need to do to enable updating data when a new date range is selected! Update our extension's page, and try playing with the date range selector to get data for different periods.
Adding native placeholder components to display while data is loading
When data is loading, our extension currently says "Waiting...", and that's all it does. This works, but we can do better. Let's add the exact same placeholder components that out-of-the-box reports in WooCommerce use:
- In
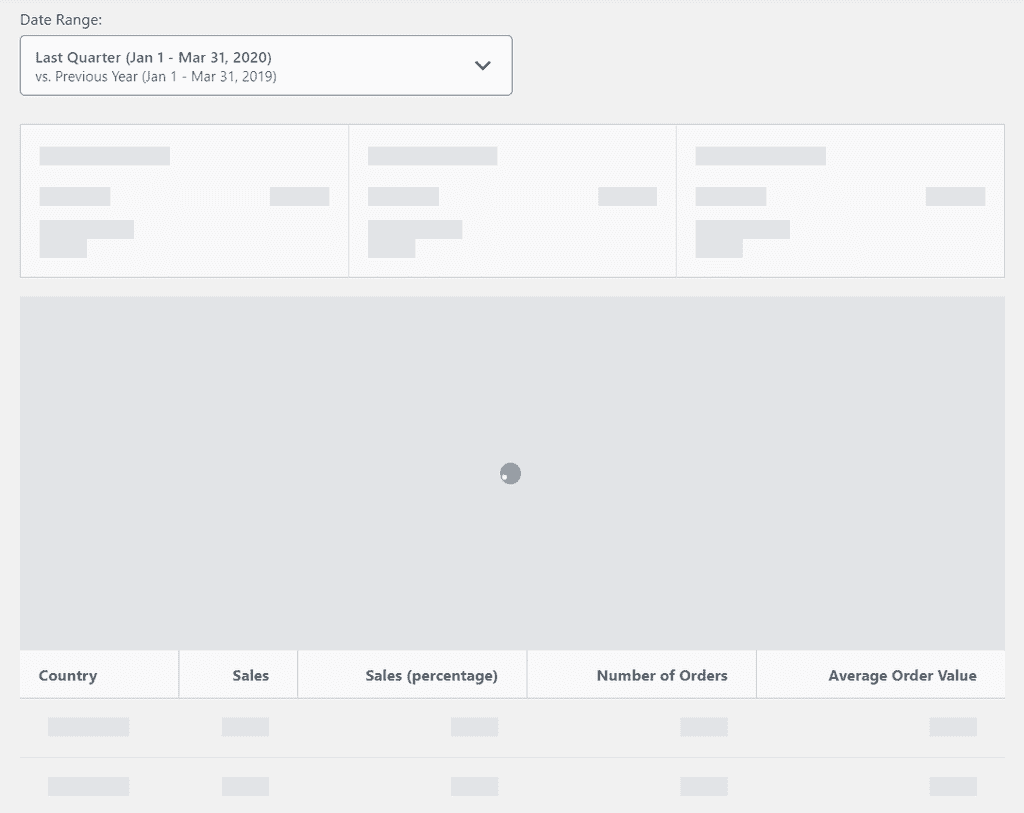
SalesByCountryReport'srender()method, you should now have two conditional return statements. Locate the return statement that executes when data is loading (this.state.data.loading), and replace it with the following code:These are placeholder components for summary list, chart, and table that WooCommerce provides as part of its React component library. For the summary list placeholder, we specify how many summary blocks we want, for the chart we specify the desired height in pixels, and for the table we provide a caption and the same set of headers that we pass over to ourJAVASCRIPTreturn <Fragment>{reportFilters}<SummaryListPlaceholder numberOfItems={3}/><ChartPlaceholder height={300}/><TablePlaceholder caption={__("Top Countries", "wc-admin-sales-by-country")}headers={tableHeaders}/></Fragment>CountryTablecomponent. Note that before any of these components, we render the sameReportFiltersthat we use for loaded data. That's because it doesn't need to wait for new data: it already displays the new date range.
When you refresh our extension's page in the browser, here's what you should see while data is loading:
Adding a chart component to visualize per-country data
We have just added a set of placeholder components, and one of them was for a chart component. The problem is that we don't currently have a real chart component to visualize country data. This is what we're going to address now.
As you may recall, native chart components provided by WooCommerce are limited in that they can only plot time series data on the X axis. Because we want to break data down by country instead of a time period, we'll need to go with a third-party React component. There's quite a choice of libraries to use, including canvasJS, Recharts, ApexCharts, and Victory. We'll go with Recharts for this example.
Integrating a third-party bar chart component
To install Recharts, run the following command in the root directory of our extension:
SHELLnpm install rechartsGo to
SalesByCountryReport.js. In therender()method, you should have a destructuring assignment statement that goes like this:const {data, currency} = this.state;. Modify it so that it includesdateQueryas well:JAVASCRIPTconst {data, currency, dateQuery} = this.state;Scroll down to
render()'s return statement that executes when data has been loaded. BetweenSummaryListandCountryTablecomponent calls, insert a new component call:JAVASCRIPT<CountryChart chartData={data.countries}dateRange={dateQuery.primaryDate.range}currency={currency}/>Scroll up to the imports section in
SalesByCountryReports.js, and add a new import statement:JAVASCRIPTimport {CountryChart} from '../CountryChart/CountryChart';This is all we need to do in our main component,
SalesByCountryReports, and it's now time to actually create the chart component that we have already imported and called.Under
src/components, create a new subdirectory,CountryChart.Under
CountryChart, create a new JavaScript file,CountryChart.js.Open
CountryChart.js, and paste the following code:JAVASCRIPTimport {__} from '@wordpress/i18n';import {Component as ReactComponent} from '@wordpress/element';import {Bar, BarChart, CartesianGrid, ResponsiveContainer, Tooltip, XAxis, YAxis} from 'recharts';export class CountryChart extends ReactComponent {render() {const chartData = this.props.chartData.map(country => ({name: country.country, value: country.sales})).sort((a, b) => {if (a.value > b.value) return -1;if (a.value < b.value) return 1;return 0;});return <div className='countrychart-chart'><div className='countrychart-chart__header'><h2 className='countrychart-chart__title'>Sales by Country</h2></div><div className='countrychart-chart__body countrychart-chart__body-column'><div className='d3-chart__container'><ResponsiveContainer width='100%' height={300}>{chartData.length > 0? (<BarChart data={chartData}><CartesianGrid vertical={false}/><Bar dataKey='value' fill='#52accc'/><XAxis dataKey='name'/><YAxis domain={[0, dataMax => (Math.round(dataMax * 1.05 / 100) * 100)]}/></BarChart>): <div className='d3-chart__empty-message'>{__('No data for the selected date range', 'wc-admin-sales-by-country')}</div>}</ResponsiveContainer></div></div></div>}}Let's see what's going on here:
- This is a stateless component, and it only has one method:
render(). - Before returning anything from
render(), we transform the incoming array of country data into a format that our bar chart component understands. Then, we sort the resulting array by absolute sales, and save it into thechartDataconstant. - In the return statement, we check if
chartDatacontains data for at least one country, and if it does, we visualize the data using theBarChartcomponent imported from Recharts. IfchartDatais empty, we instead show a message indicating that there's no data for a selected date range. - Note the
YAxiscomponent that is nested withinBarChart. It receives a prop calleddomainthat defines the range of possible values plotted on the Y axis. Since we want to leave some space between the highest bar in our chart and the chart's upper boundary, we take the largest data point inchartData, multiply it by 1.05, and round down to an integer. - The
BarChartcomponent is wrapped in another Recharts component,ResponsiveContainer, that helps the bar chart adapt to various screen sizes. ResponsiveContaineris wrapped in a cascade ofdivelements that use classes from WooCommerce's own spreadsheets. This helps make our component feel as consistent with native components as possible.
- This is a stateless component, and it only has one method:
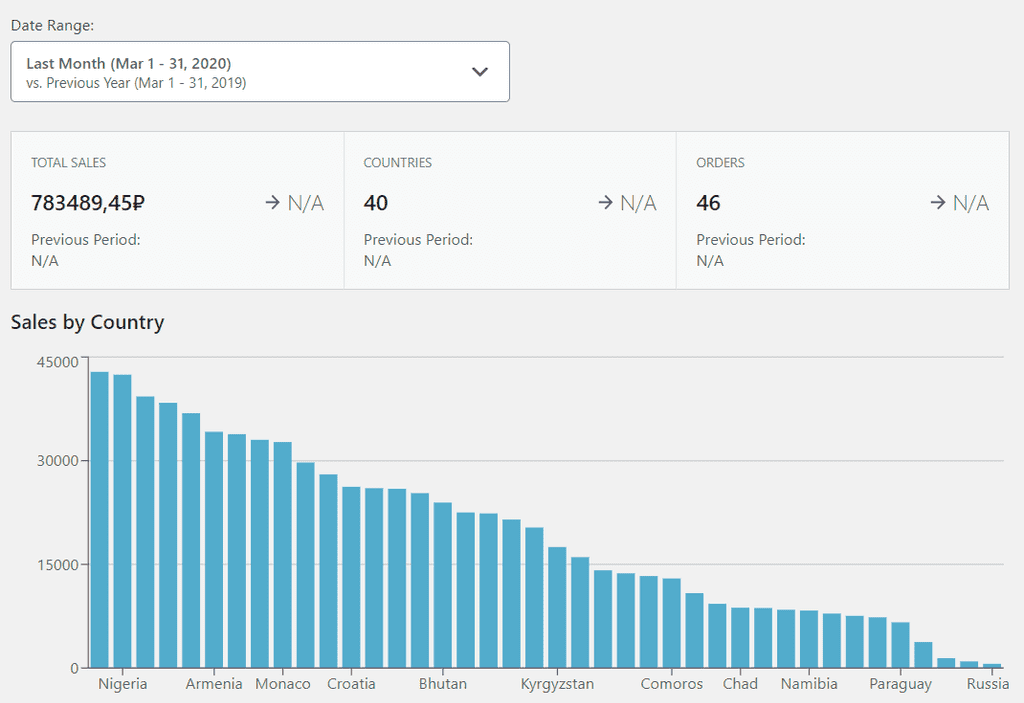
If we now refresh our extension's page in the browser, we should see something like this:
Adding a custom tooltip
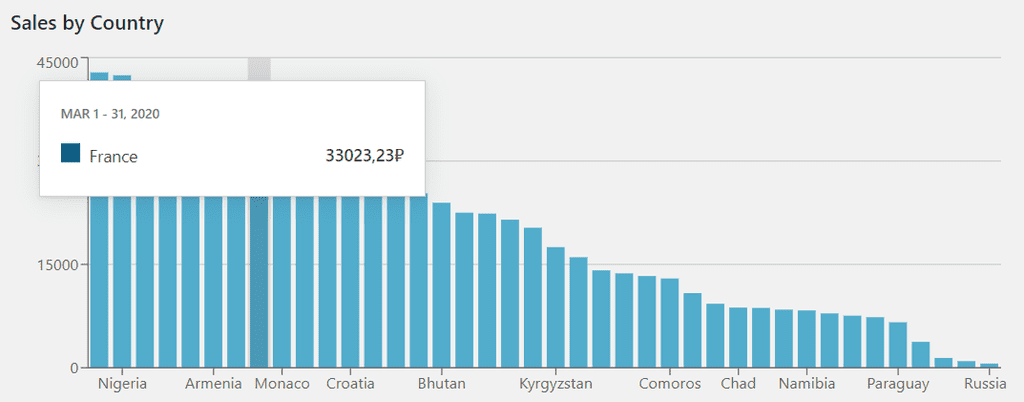
Having a bird's-eye view of sales breakdown by country like this is useful, but still there's something missing. What if we want to see how much revenue came from a country represented by the 18th bar from the left? That's hard to do right now, and to make it easy, we need to implement a tooltip for the bar chart.
Under
src/components, create a new subdirectory,CustomTooltip.Under
CustomTooltip, create a new JavaScript file,CustomTooltip.js.Open
CustomTooltip.js, and paste the following code:JAVASCRIPTimport {Component as ReactComponent} from '@wordpress/element';export class CustomTooltip extends ReactComponent {render() {return <div className='d3-chart__tooltip'><h4>{this.props.dateRange}</h4><ul><li className='key-row'><div className='key-container'><span className='key-color' style={{backgroundColor: '#096484'}}/><span className='key-key'>{this.props.label}</span></div><span className='key-value'>{this.props.currency.render(this.props.payload[0].value)}</span></li></ul></div>}}This is a simple component that displays a tooltip with a date range, country name (passed in as
this.props.label), and total sales (passed in as the first array item inthis.props.payload). For style consistency, the component uses markup structure and styles taken from WooCommerce's own tooltips in out-of-the-box analytics reports.Go back to
CountryChart.js, and add two new import statements:JAVASCRIPTimport {CustomTooltip} from '../CustomTooltip/CustomTooltip';import './CountryChart.scss'Scroll down to the
render()method inCountryChart, and paste the following code as a nested component ofBarChart, next toXAxis,YAxis, and other nested components:JAVASCRIPT<Tooltipcursor={{fill: 'rgba(0, 0, 0, 0.1)'}}content={({active, payload, label}) => {return !active ? null :(<CustomTooltip payload={payload}label={label}dateRange={this.props.dateRange}currency={this.props.currency}/>);}}/>Tooltipis Recharts' own tooltip component that allows to customize its content with thecontentprop. This prop receives a function that checks if the tooltip is currently active (that is, if the user has hovered over a bar in the chart), and if it is, it displays our own custom tooltip that we have just created and imported.Under
src/components/CountryChart, create a new Scss stylesheet,CountryChart.scss.Open
CountryChart.scss, and paste the following styles:SCSS.recharts-tooltip-wrapper .d3-chart__tooltip {visibility: visible !important;left: 24px;top: 24px;}
If we now refresh our extension's page and hover over a bar in the bar chart, we should now see a tooltip showing total sales for the selected country:
Styling the bar chart
Our bar chart is fully functional, which is great! Still, there are a few details about its appearance that can be improved: borders, background, axis lines, tick lines, tooltip margins, and fonts used for labels. Let's add styles that will address these issues.
Open
CountryChart.scss, select all content, and replace it with the following styles:SCSS$font-family: -apple-system, BlinkMacSystemFont, "Segoe UI", Roboto, Oxygen-Sans, Ubuntu, Cantarell, "Helvetica Neue", sans-serif;$studio-white: #fff;$core-grey-light-700: #ccd0d4;$gap-large: 24px;$gap: 16px;$wp-admin-sidebar: #24292d;.recharts-yAxis.yAxis line {stroke: transparent;}.recharts-yAxis .recharts-cartesian-axis-tick-line {visibility: hidden;}.recharts-tooltip-wrapper .d3-chart__tooltip {visibility: visible !important;left: $gap-large;top: $gap-large;}.recharts-cartesian-axis text tspan{font-family: $font-family;font-size: 10px;}.recharts-cartesian-grid-horizontal line {stroke: #e2e4e7;stroke-width: 1;shape-rendering: crispEdges;}.countrychart-chart {margin-top: -$gap;margin-bottom: $gap-large;background: $studio-white;border: 1px solid $core-grey-light-700;border-top: 0;.countrychart-chart__header {min-height: 50px;border-bottom: 1px solid $core-grey-light-700;display: flex;flex-flow: row wrap;justify-content: space-between;align-items: center;width: 100%;.countrychart-chart__title {height: 18px;color: $wp-admin-sidebar;font-size: 15px;font-weight: 600;line-height: 18px;margin-left: $gap;margin-right: $gap;}}.countrychart-chart__body {display: flex;flex-direction: row;justify-content: flex-start;align-items: flex-start;width: 100%;&.countrychart-chart__body-column {flex-direction: column;margin-top: $gap;}}}
If we refresh our extension's page in the browser, here's what we'll see:
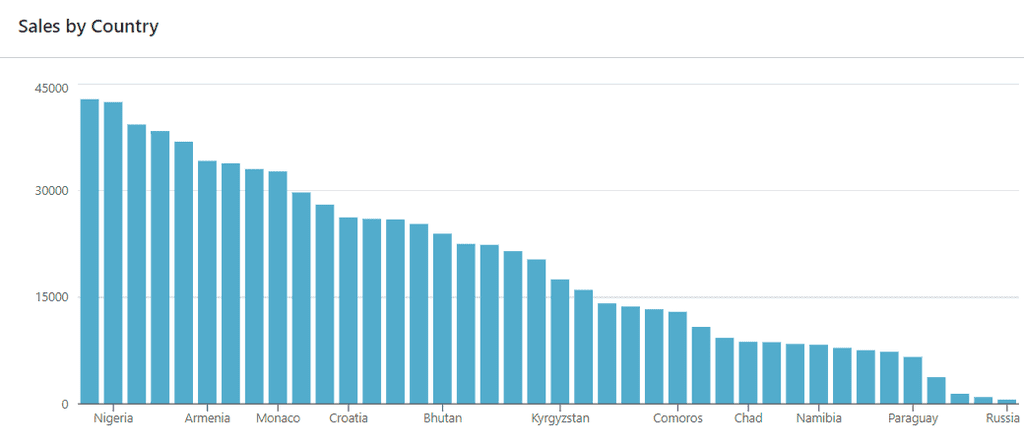
This is much nicer! Background color, layout of the chart header, font properties used in chart labels, transparent ticks on the Y axis, line strokes in the grid: the new styles make the bar chart component way less contrasting when put next to native components.
Finishing touches
We're almost done, and there's only one minor thing left to do. Our bar chart and our table both have headers, and the styles of these headers currently look very different:
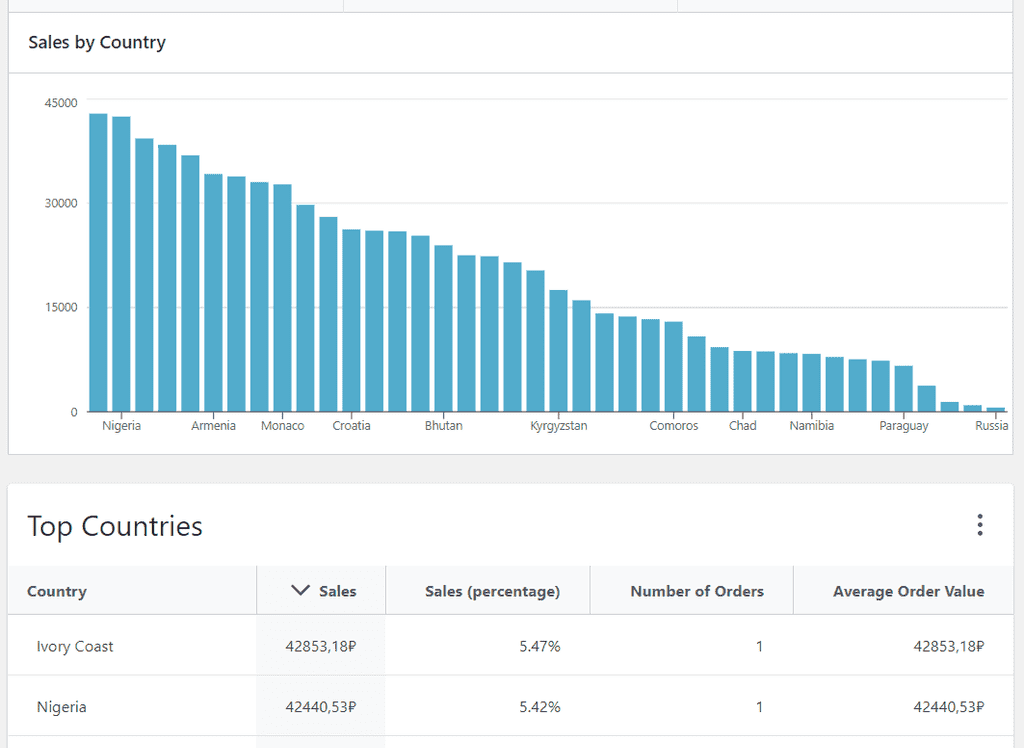
Let's modify the table header to make it look consistent with the bar chart header:
Go to
src/components/CountryTable, and create a new Scss stylesheet,CountryTable.scss.Open
CountryTable.scss, and paste the following styles:SCSS.table_top_countries h2 {font-size: 15px;font-weight: 600;}Go to
CountryTable.js, and add a new import statement:JAVASCRIPTimport './CountryTable.scss'Scroll down to
CountryTable'srender()method, and in the return statement, add the following prop to theTableCardcomponent:JAVASCRIPTclassName="table_top_countries"
This should be enough to make the styles of the two headers look alike:
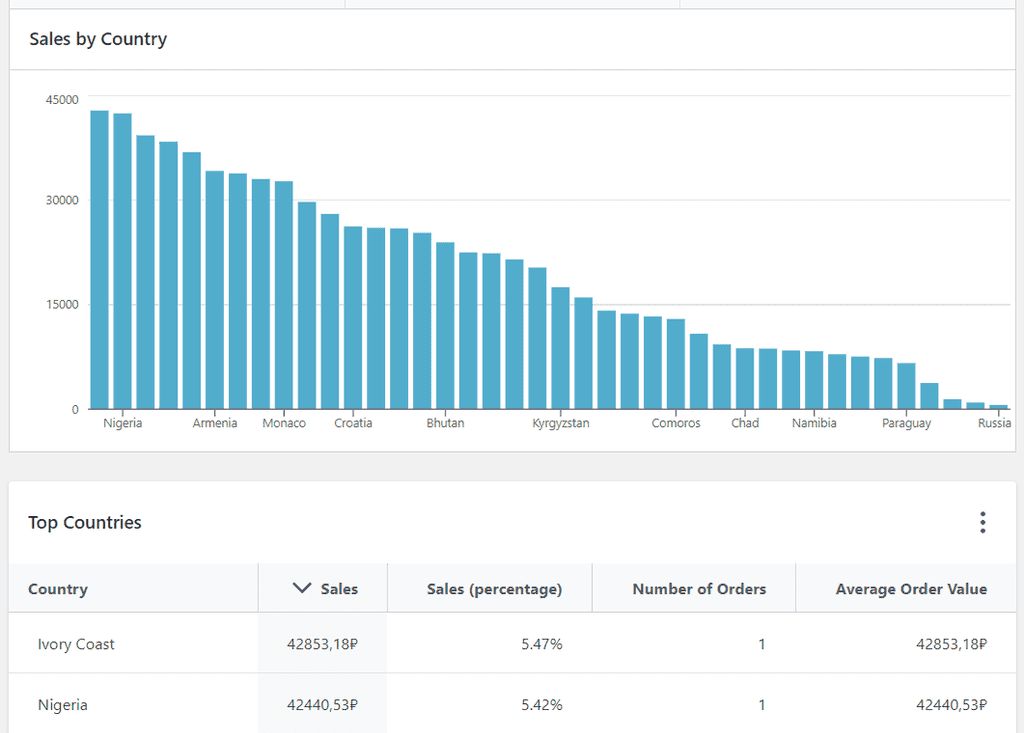
Finally, let's get rid of something that we haven't used since it was generated: under src/components, delete the empty index.scss stylesheet.
That's it!
We have come a long way since facing the boilerplate extension code that WooCommerce helped us generate. What we have now is a fully functional WooCommerce extension that fetches and transforms WooCommerce store data via REST API, visualizes the data using components provided by WooCommerce, as well as third-party components, and has a near-native look and feel:
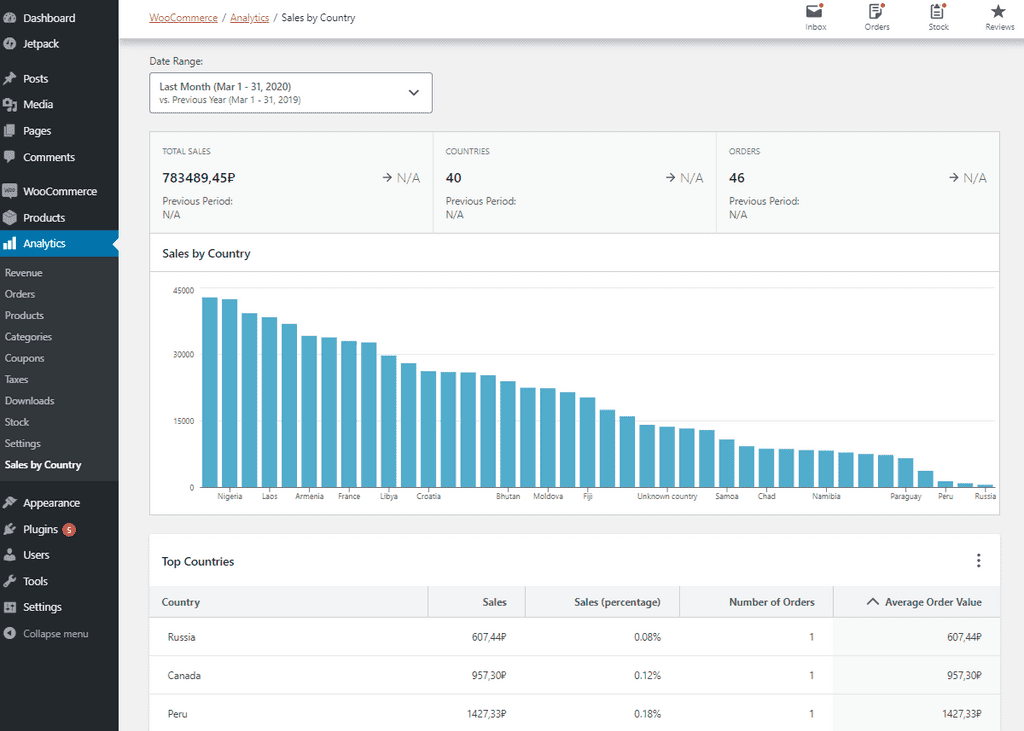
If you got stuck following along this tutorial, or if you're only interested in looking at the end result, check out the full source code of this extension.